This example shows how to easily visualize data from big datasets in reports. The freely available software packages R, LyX and LaTeX yield flawless graphs.
R imports data while LaTeX typesets
Set your Text demonstrates the powerful data visualization capabilities of LyX, LaTeX and R in the report “Nitrogen dioxide concentration in Dutch air” (pdf, or see below this text). R starts with importing some five years of hourly NO2-measurements from a csv text-file. Each time LyX (LaTeX) typesets the report, it carries out the import procedure, calculations and graph drawing. The use of R-code for this and other projects saves time.
Smoothing data and graphing error bars
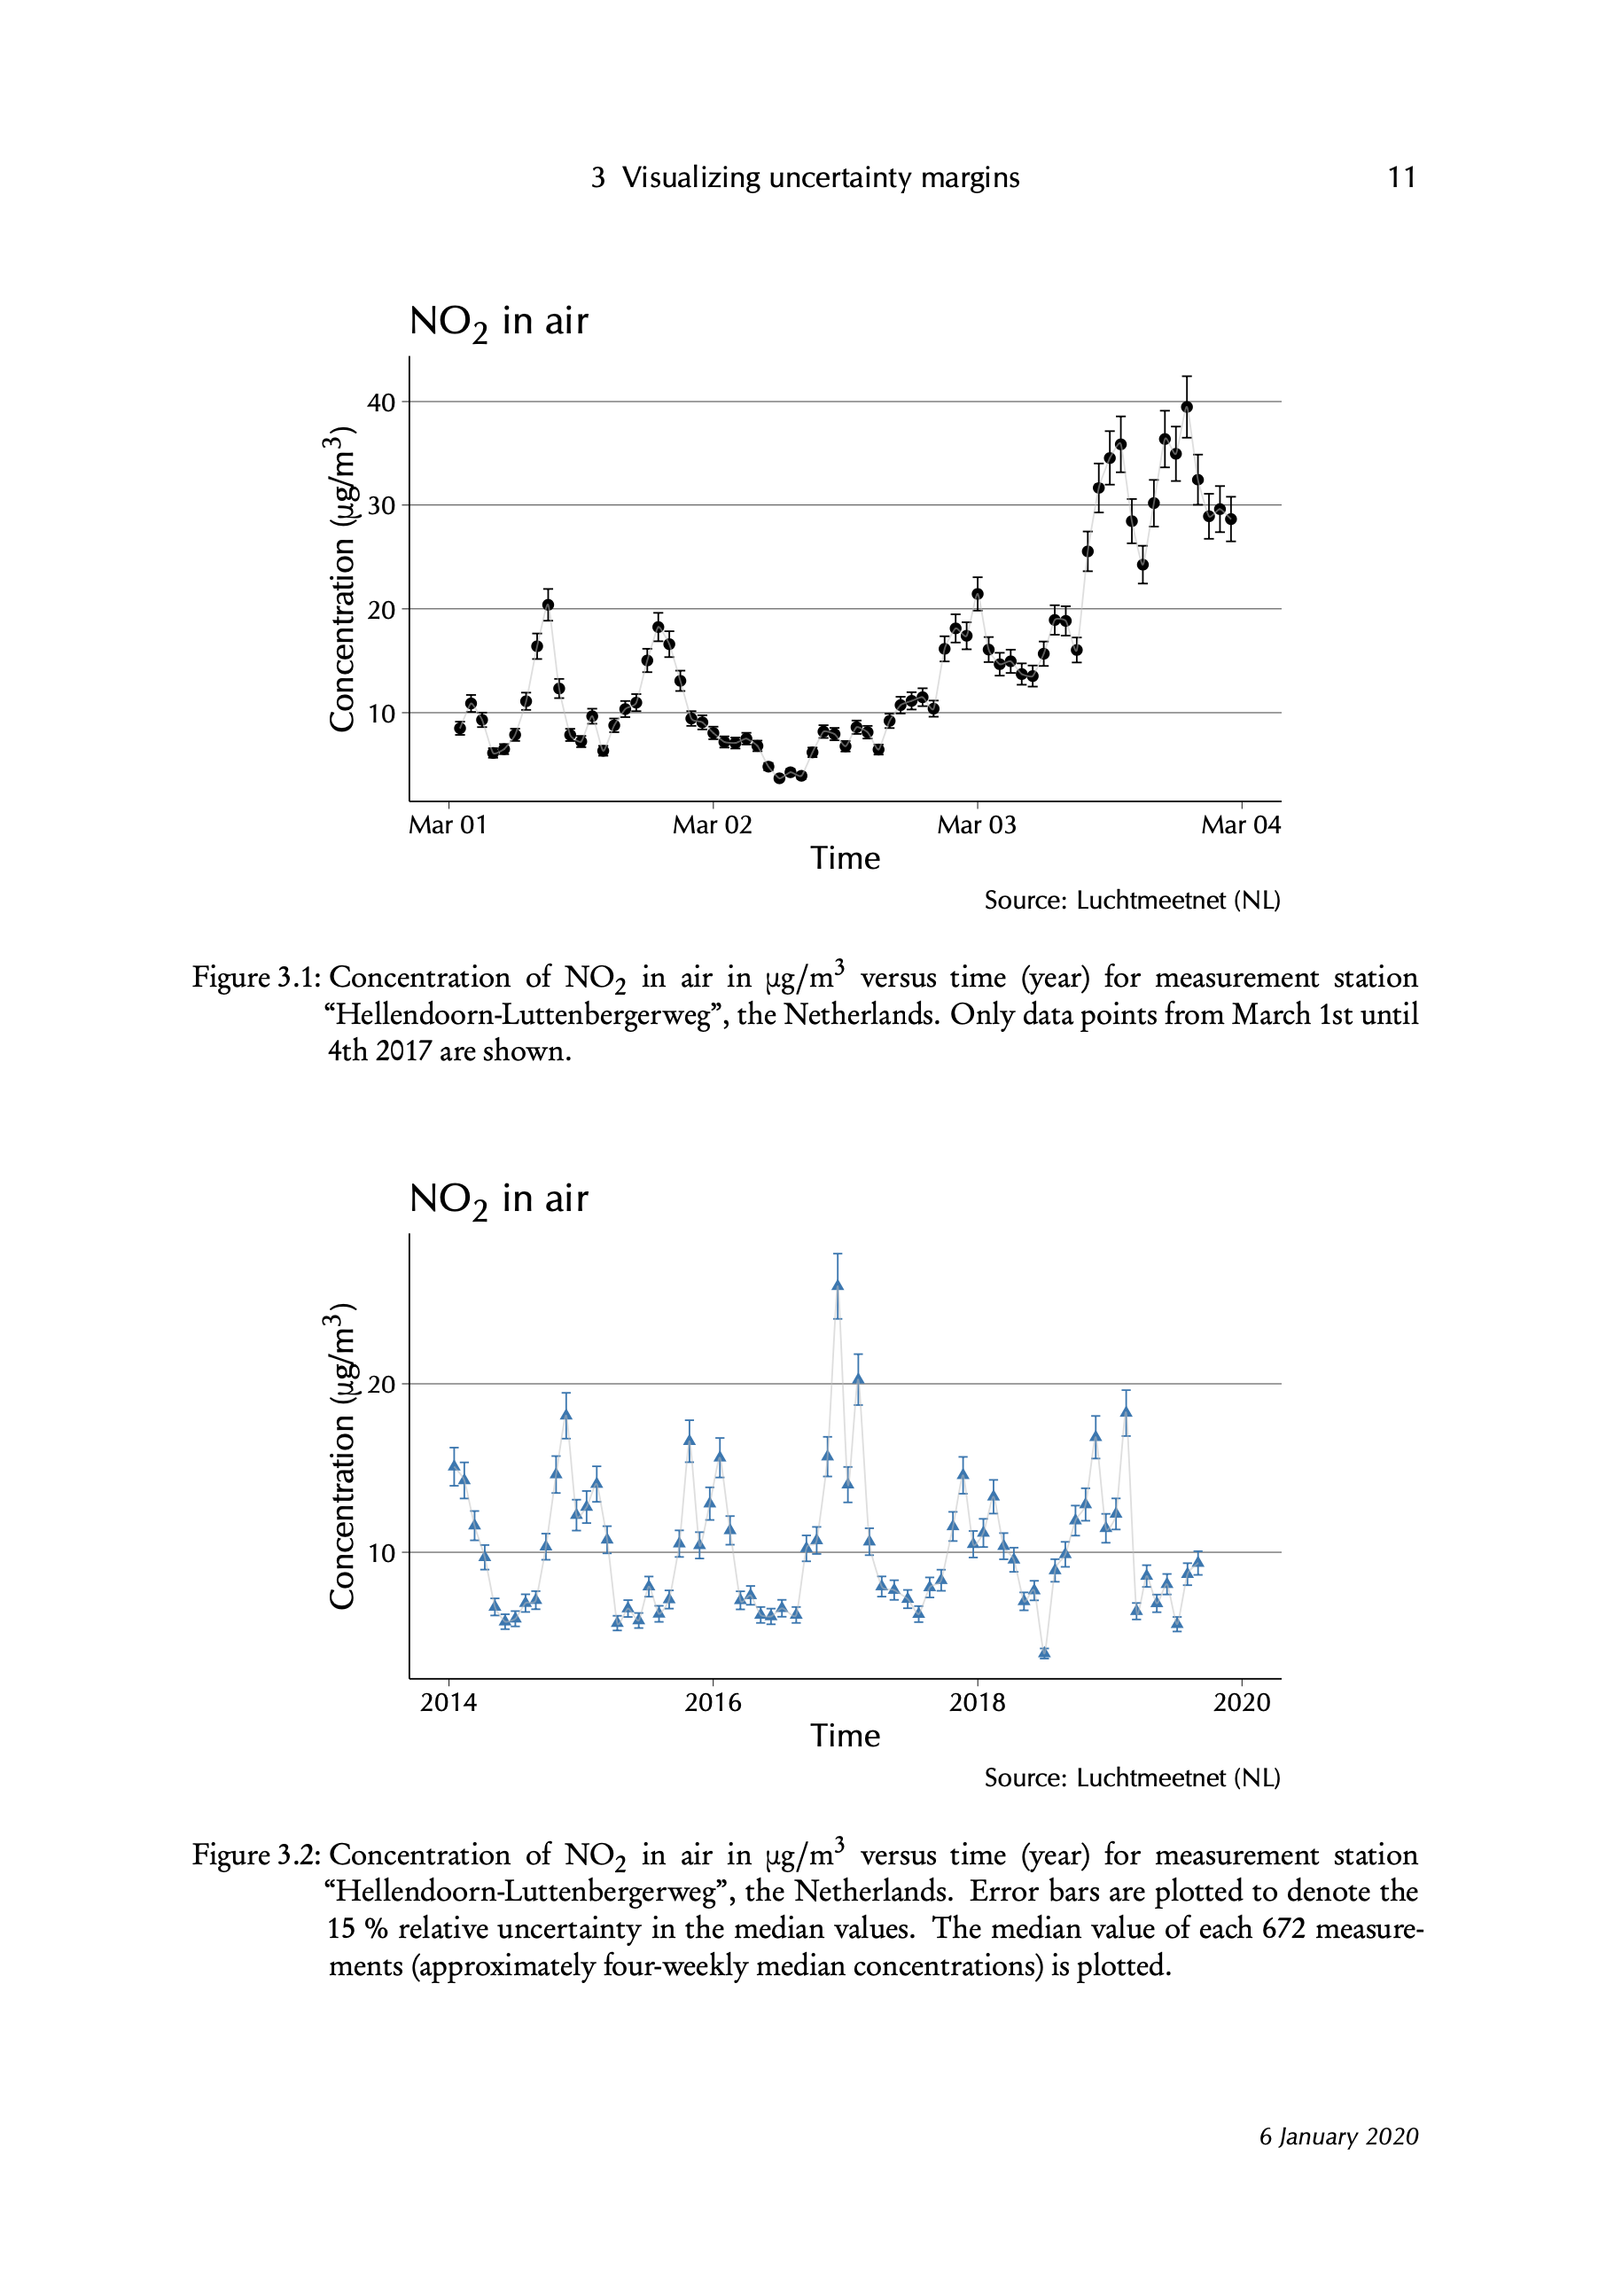
48,000 measurements do not fit nicely in one graph. Therefore, the report explores skipping measurements, calculating mean and median values, smoothing automatically as well as in a more advanced manner. Uncertainty margins are visualized using error bars. All these calculations are performed using a few lines of R-code. The graphs are drawn using vectors, thus one can zoom in endlessly.
R-code is visible to the reader
The LyX-document contains a reference to the .R text file containing all R-code that is used for the graphs in the report. LaTeX runs this code while typesetting the pdf-file. Relevant fragments of R-code are typeset throughout the report, for explaining the reader some of the R-commands. The appendix contains the total .R text file, typeset in R color syntax. Thus, the typeset report contains a copy of all R-code used in data processing. The user can apply this R-code easily to other datasets. This makes research reproducible.
On the used measurement data
A part of the many concentration measurement data on nitrogen dioxide in Dutch air that are available to the public are used for the report “Nitrogen dioxide concentration in Dutch air” (pdf, or see below this text). These data offer a good opportunity to showcase the capabilities of R in combination with LyX and LaTeX. Set your Text focuses here on the data and its representation. This stands apart from the nitrogen crisis that really took off in the Netherlands in 2019.
Set your Text helps with data projects
Are you doing a project that involves a lot of measurement data or other data? You might ask Set your Text for advice on your project. This could save you quite some work in the future and makes your project more appealing.